"ADA Price Prediction: Navigating Bearish Technicals vs. Bullish Fundamentals"

#ADA
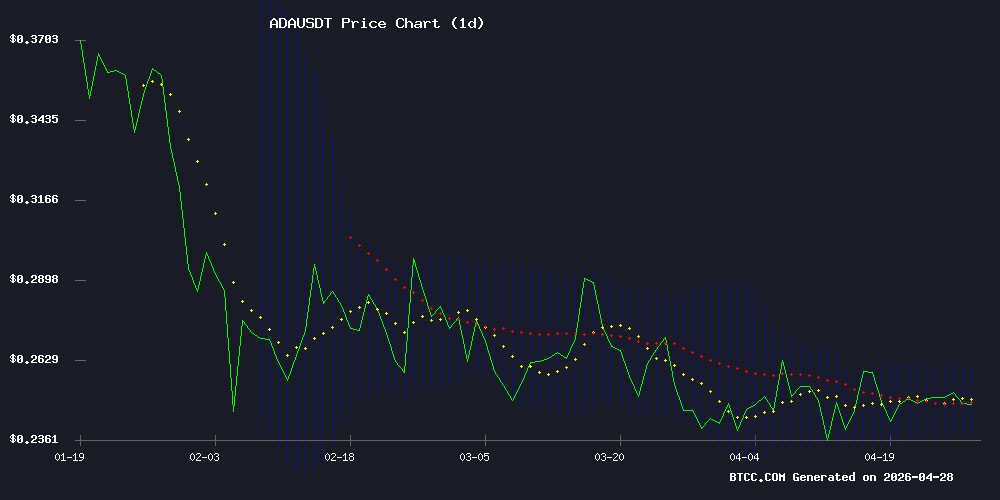
- ADA trades at 0.2458 USDT, below its 20-day moving average, signaling short-term bearish pressure.
- MACD and Bollinger Bands confirm downward momentum, though a bounce from the lower band is possible.
- Fundamentals remain bullish due to Cardano’s decentralization defense, but technicals suggest caution.
ADA Price Prediction
ADA Price Prediction: Bearish Signals Dominate Short-Term Outlook
According to BTCC financial analyst Robert, Cardano (ADA) is currently trading at, slightly below its 20-day moving average of. The MACD indicator shows a bearish crossover with values at, suggesting continued downward momentum. Bollinger Bands indicate a range-bound market with the upper band at, middle band at, and lower band at. 'The price is hovering near the lower band, which could signal a potential bounce, but the overall trend remains bearish until we see a clear break above the 20-day MA,' Robert commented.
Mixed Sentiment: Hoskinson Defends Decentralization, ADA Tests Key Monthly Support
News headlines reveal a tug-of-war in market sentiment. On one side, founder Charles Hoskinson defends Cardano’s decentralization focus amidst rival criticism, reinforcing long-term bullish fundamentals. However, short-term technical pressure is evident as ADA retests major monthly support levels and remains stuck in a narrow trading range amid a prevailing bearish trend. 'The fundamentals remain intact, but technicals are king in the short term. The monthly support test is crucial for determining the next major move,' said BTCC financial analyst Robert.
Factors Influencing ADA’s Price
Hoskinson Defends Cardano's Decentralization Focus Amid Rival Criticism
Cardano founder Charles Hoskinson has reaffirmed the blockchain's commitment to decentralization, positioning it as a long-term counterpoint to rival networks he accuses of prioritizing rapid growth over foundational principles. His remarks come as the project faces scrutiny for its slower adoption curve compared to competitors.
Hoskinson specifically criticized unnamed chains for taking 'shortcuts' in governance and scalability, suggesting Cardano's methodical approach will prove superior in sustainability and security. The commentary reflects ongoing philosophical divisions in crypto between speed-to-market and architectural purity.
Cardano Retesting Major Monthly Support: Possible Scenarios from Here
Cardano approaches a critical juncture as its price hovers near a long-standing support level at $0.240. The digital asset, which had shown signs of upward momentum, now faces resistance in sustaining bullish traction.
Market participants are closely monitoring ADA's behavior at this key technical level, which could determine its near-term trajectory. Failure to hold this support may signal further downside, while a rebound could reignite bullish sentiment.
Cardano ADA Stuck in Narrow Trading Range Amid Bearish Trend
Cardano's ADA has been trading between $0.240 and $0.265, struggling to break free from a bearish trend that began earlier this year. Despite a 1% gain today to $0.2512, the cryptocurrency remains 41% below its January 2026 peak of $0.430. Resistance levels at $0.305 and $0.300 have repeatedly thwarted recovery attempts.
Launched in 2017 by Ethereum co-founder Charles Hoskinson, Cardano has established itself as a leading third-generation blockchain. Its research-driven approach focuses on scalability and sustainability, offering an energy-efficient alternative to Ethereum. ADA, the network's native token, facilitates transactions, staking, and governance.
Recent 4-hour charts show ADA briefly surged to $0.312 in late February before plunging again in March. The coin now battles to hold the $0.235–$0.240 support zone. A breach below this level could trigger further declines.
Is ADA a good investment?
Based on the current data, ADA appears to be a cautious 'hold' rather than a clear 'buy' or 'sell' right now. Here is a breakdown of key factors:
| Factor | Signal | Detail |
|---|---|---|
| 20-Day MA Position | Bearish | Price (0.2458) slightly below MA (0.2490) |
| MACD | Bearish | Negative histogram (-0.001788) indicates downward momentum |
| Bollinger Bands | Neutral | Price near lower band; possible bounce but no confirmation |
| News Sentiment | Mixed | Fundamentals strong (Hoskinson), but technical bearishness dominates |
| Long-Term Outlook | Bullish Potential | Retesting major monthly support could set up a reversal |
For long-term holders, this may be a accumulation zone, but short-term traders should wait for a breakout above 0.2490 USDT before entering.

Log in to Reply
Log in to comment your thoughtsComments
Related Articles
|Square
Get the BTCC app to start your crypto journey
Get started today Scan to join our 100M+ users